


How to Analyze Ad Creatives: The Unicorn Ad Framework
Your best ad already told you what to make next.
Most teams chase the next winning ad. Almost none study the ones they already have.
That's the mistake. Your best-performing creative is not a lucky one-off. It's a formula. And if you can break that formula down, you can repeat it instead of starting from a blank page every sprint.
This is the Quick Performance Analysis method Mirella Crespi teaches inside the Academy. It's the fastest creative performance analysis you can run on your own account: a structured pass that turns your best ad into your next blueprint. Here's the mini version you can run today.
How to analyze your ad creatives and turn your best ad into a repeatable formula:
Find your unicorn, the ad quietly absorbing most of your spend
Dissect why it actually wins, block by block
Prove the pattern across the rest of your winners
Step 1: Find your unicorn ad
Every account has a unicorn. It's the single creative that has quietly absorbed most of your budget while outperforming everything else for months. It takes a disproportionate share of spend, it holds up over long stretches, and it keeps delivering results no matter where you put it.
"It doesn't matter how many times you launch it into new campaigns or new audiences. Meta always seems to send budget to that creative."
Mirella Crespi, CEO, Creative Milkshake
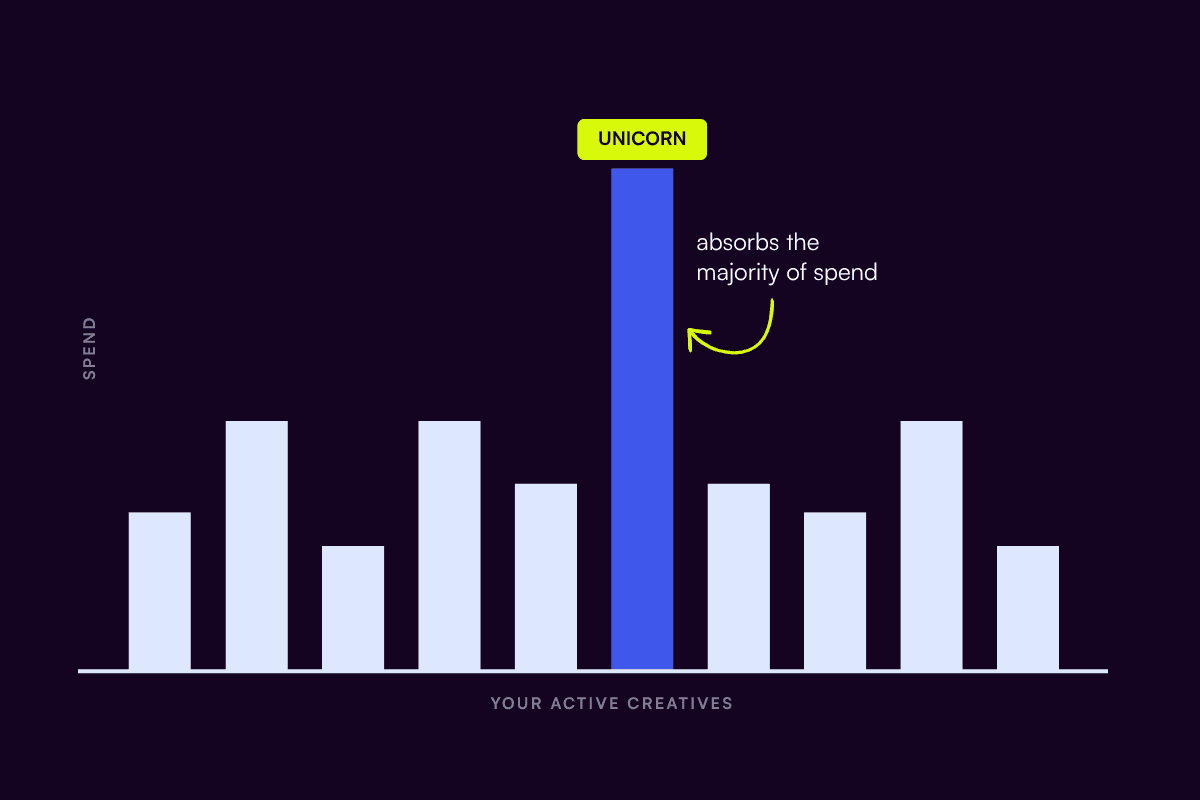
That ad is your benchmark, because your single best performer is also your best blueprint. The catch is that most people never identify it correctly, because they look at the wrong number.
Signs you've found a unicorn
✓ It takes a disproportionate share of your total spend
✓ It holds performance for months, not just a strong week
✓ It delivers consistent results, not a one-time ROAS spike
✓ It survives audience refreshes instead of fading after one
✓ It keeps performing as you launch it into new campaigns and audiences
If an ad checks most of these boxes, that's your unicorn. If it only spikes for a week and then fades, it's a top performer, not a unicorn, and that distinction shapes everything that follows.
Try this. Sort your account by spend, not by last week's ROAS. The ad that has absorbed the most budget over the longest stretch is your unicorn. This is not your top performer from the last seven days. It's the creative that has shown staying power.
Step 2: Dissect why it actually wins
A winner you can't explain is a winner you can't repeat. So take your unicorn apart, section by section, and write down exactly what it's doing. This is the Building Blocks framework, one of many creative strategy frameworks worth keeping in your toolkit.
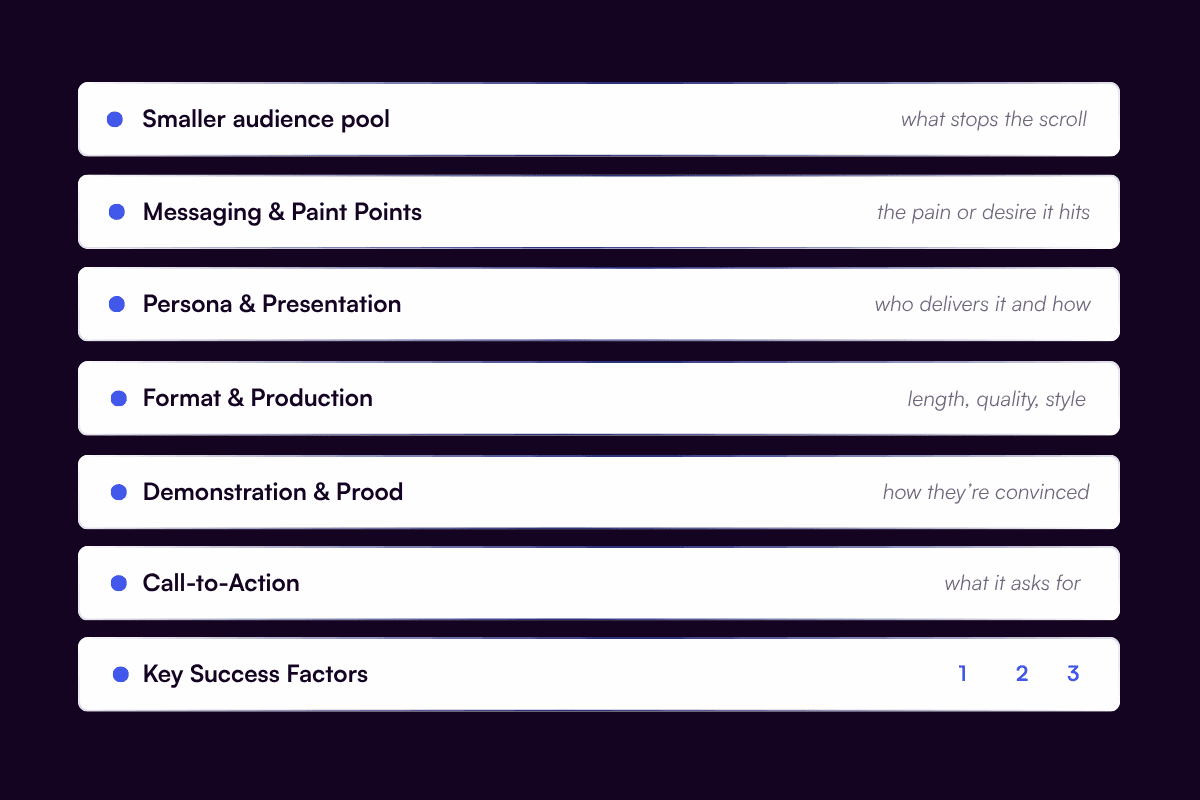
That exact combination, the hook plus the pain point plus who delivers it plus the format plus the proof plus the CTA, is your creative success formula. It's the specific mix of elements that resonates most deeply with your audience, and it's a gold mine for iteration.
Add to your process. Write the formula down. Every new concept you brief should either reuse a proven block or deliberately test against one. That single habit turns random creative production into a system.
Step 3: Prove the pattern across your winners
One unicorn is a data point. A repeated pattern is a strategy. So check which of your unicorn's success factors show up again across your other top ads, then compare your 30-day winners against your 7-day winners to see what's holding and what's fatiguing.
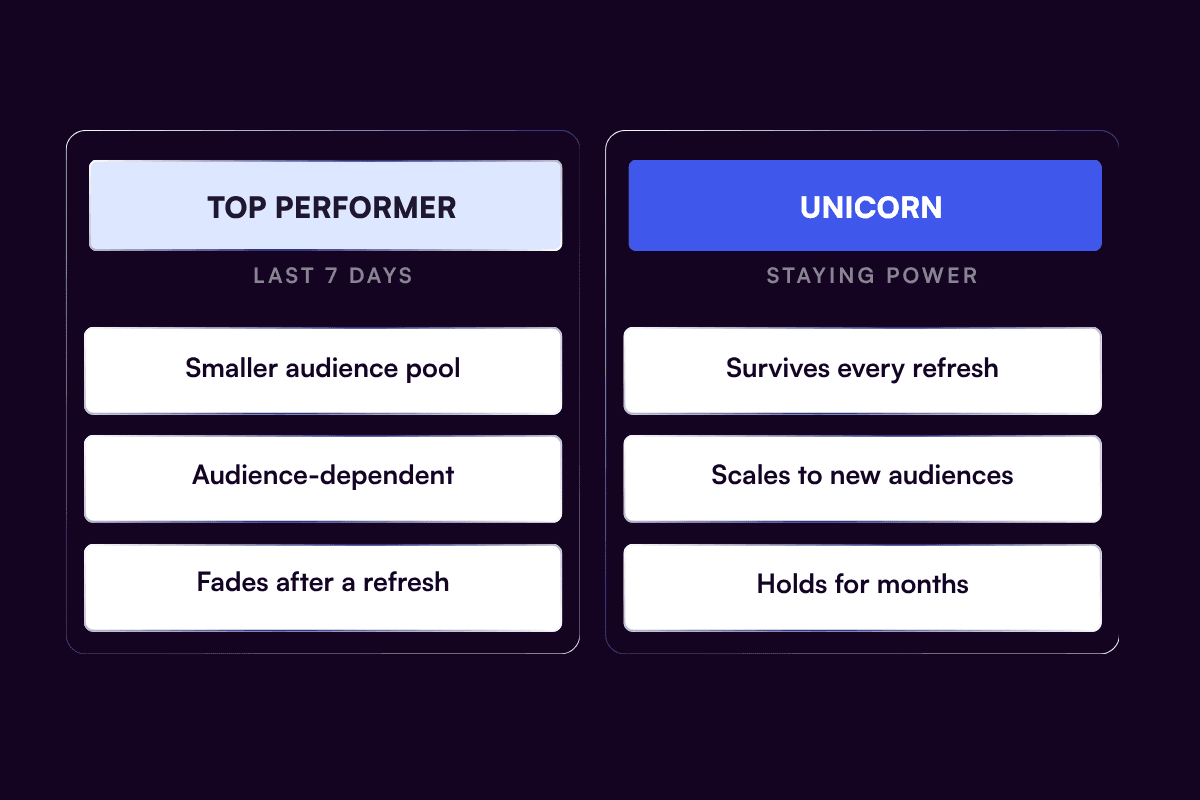
What repeats across both lists is signal. What drops off is noise. The difference between a short-term top performer and a true unicorn is durability: a unicorn keeps working as you scale it to new audiences and refresh it, while a flash-in-the-pan winner fades the moment the audience tires of it.
Tip. Track how many of your 30-day winners are still in your 7-day top performers. That number is your creative fatigue rate, and it tells you how fast you need to feed the account fresh concepts.
Zoom out: is your unicorn still a unicorn?
A great ad six months ago isn't automatically a great ad today. Before you build your next sprint around it, zoom out and look at the last six months in two-month blocks. Which formats and angles have stayed effective, which have quietly declined, and is there seasonality you keep forgetting (a style that only works in Q4, an angle that fades every summer)?
The 6-Month Trend View
Separate enduring principles from temporary trends.
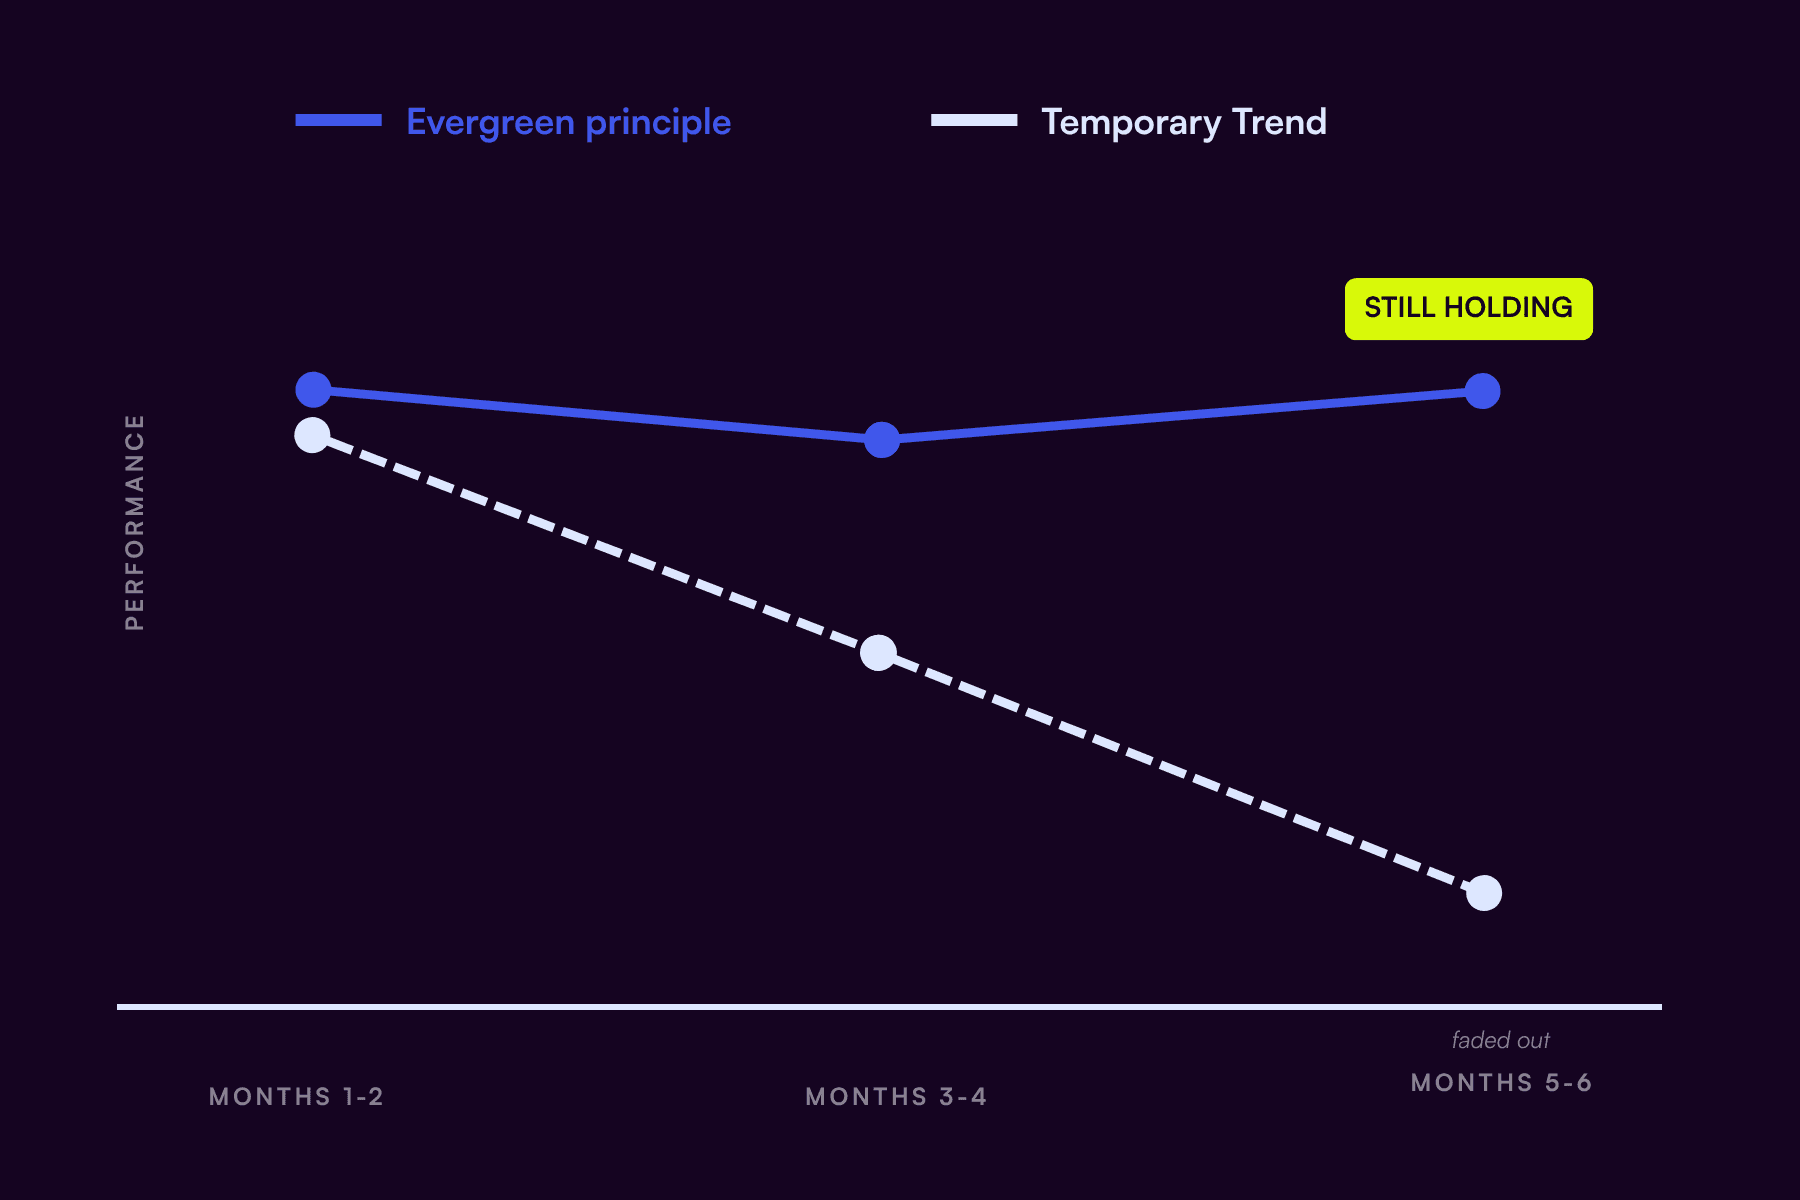
What holds across all three blocks is a principle. What fades was a moment.
This is how you separate enduring creative principles from temporary trends. Most importantly, confirm your unicorn is still holding. If its performance has been sliding for months, it's fatiguing, and your blueprint needs refreshing before you clone it.
Try this. Pull your top performers in two-month blocks across the last six months. Anything that appears in all three blocks is an evergreen principle worth building on. Anything that appears once was a moment, not a method.
Go deeper: the two metrics behind a winning ad analysis
If you want to know why a unicorn stops the scroll and holds attention, two metrics do most of the work. They're worth calculating for your top ads.
Hook rate measures how many people stop scrolling. The formula is (3-second video views divided by impressions) times 100. A high hook rate tells you the opening frame, the first line, or the on-screen text is doing its job. As a rough guide, under 20 percent means the hook needs work, and 40 percent or higher is strong. Without a strong hook, nothing else in the ad gets a chance to convert.
Hold rate measures how many people keep watching. The formula is (ThruPlays divided by impressions) times 100. Eight to twelve percent is typical, and 20 percent or higher is strong. It reveals which storytelling approaches, pacing, and demonstrations keep attention, and it usually correlates with conversion, because Meta and TikTok reward creative that keeps people in the app.
Look at the creatives with the highest hook and hold rates and note what they share: the talent, the settings, the text overlays, the pacing. Those shared traits are your unicorn's DNA showing up again. Tools built for this, like the ones we cover in our guide to the creative strategist in the AI era, make the breakdown faster, but the thinking is the same.
Common mistakes when analyzing winning ads
Even experienced teams get this wrong in predictable ways. Watch for these.
Judging by last week instead of staying power. The most common mistake is crowning last week's top performer as your best ad. Recency is not durability. Sort by spend over a long window and weight the ads that have held up for months.
Confusing a top performer with a unicorn. A top performer often rides a smaller, specific audience and fades after a refresh. A unicorn scales to new audiences and holds for months. They are not the same thing, and they call for different decisions.
Not being able to explain the win. If you can't say why an ad works, you can't repeat it. Break every winner down to its hook, pain point, persona, format, proof, and CTA before you call it a success.
Only looking at top-line numbers. ROAS alone hides the story. Break performance down by element, format, length, hook rate, and hold rate, so you can see which specific ingredients are driving results.
Measuring against the wrong metric. ROAS or CPA may not be your North Star. If contribution margin or another number matters more to the business, judge creative against that instead.
Over-relying on a single unicorn. A unicorn is a blueprint, not a crutch. If one creative carries the entire account, you're exposed the moment it fatigues. Aim for creative diversity across messages, formats, and angles, and build a repeatable growth creative system so performance doesn't collapse when that one ad tires.
Turn the analysis into your next sprint
The point of all this isn't a tidy spreadsheet. It's a plan. Once you've found your unicorn, dissected its formula, and confirmed the pattern across your winners, close the loop by writing down four things:
Iteration opportunities. Which proven ads should you make variations of right away?
Creative gaps. Which formats or angles are underrepresented but showing promise?
Red flags. Which approaches keep underperforming and should be retired?
Low-hanging fruit. What simple changes would improve your creative mix this week?
Then turn your sharpest observations into hypotheses you can actually test. The worksheet uses a simple structure: Observation (what you noticed), Hypothesis (what you think it means), Test Plan (how you'll prove it).
From Observation to Test
Turn what you noticed into what you'll prove.
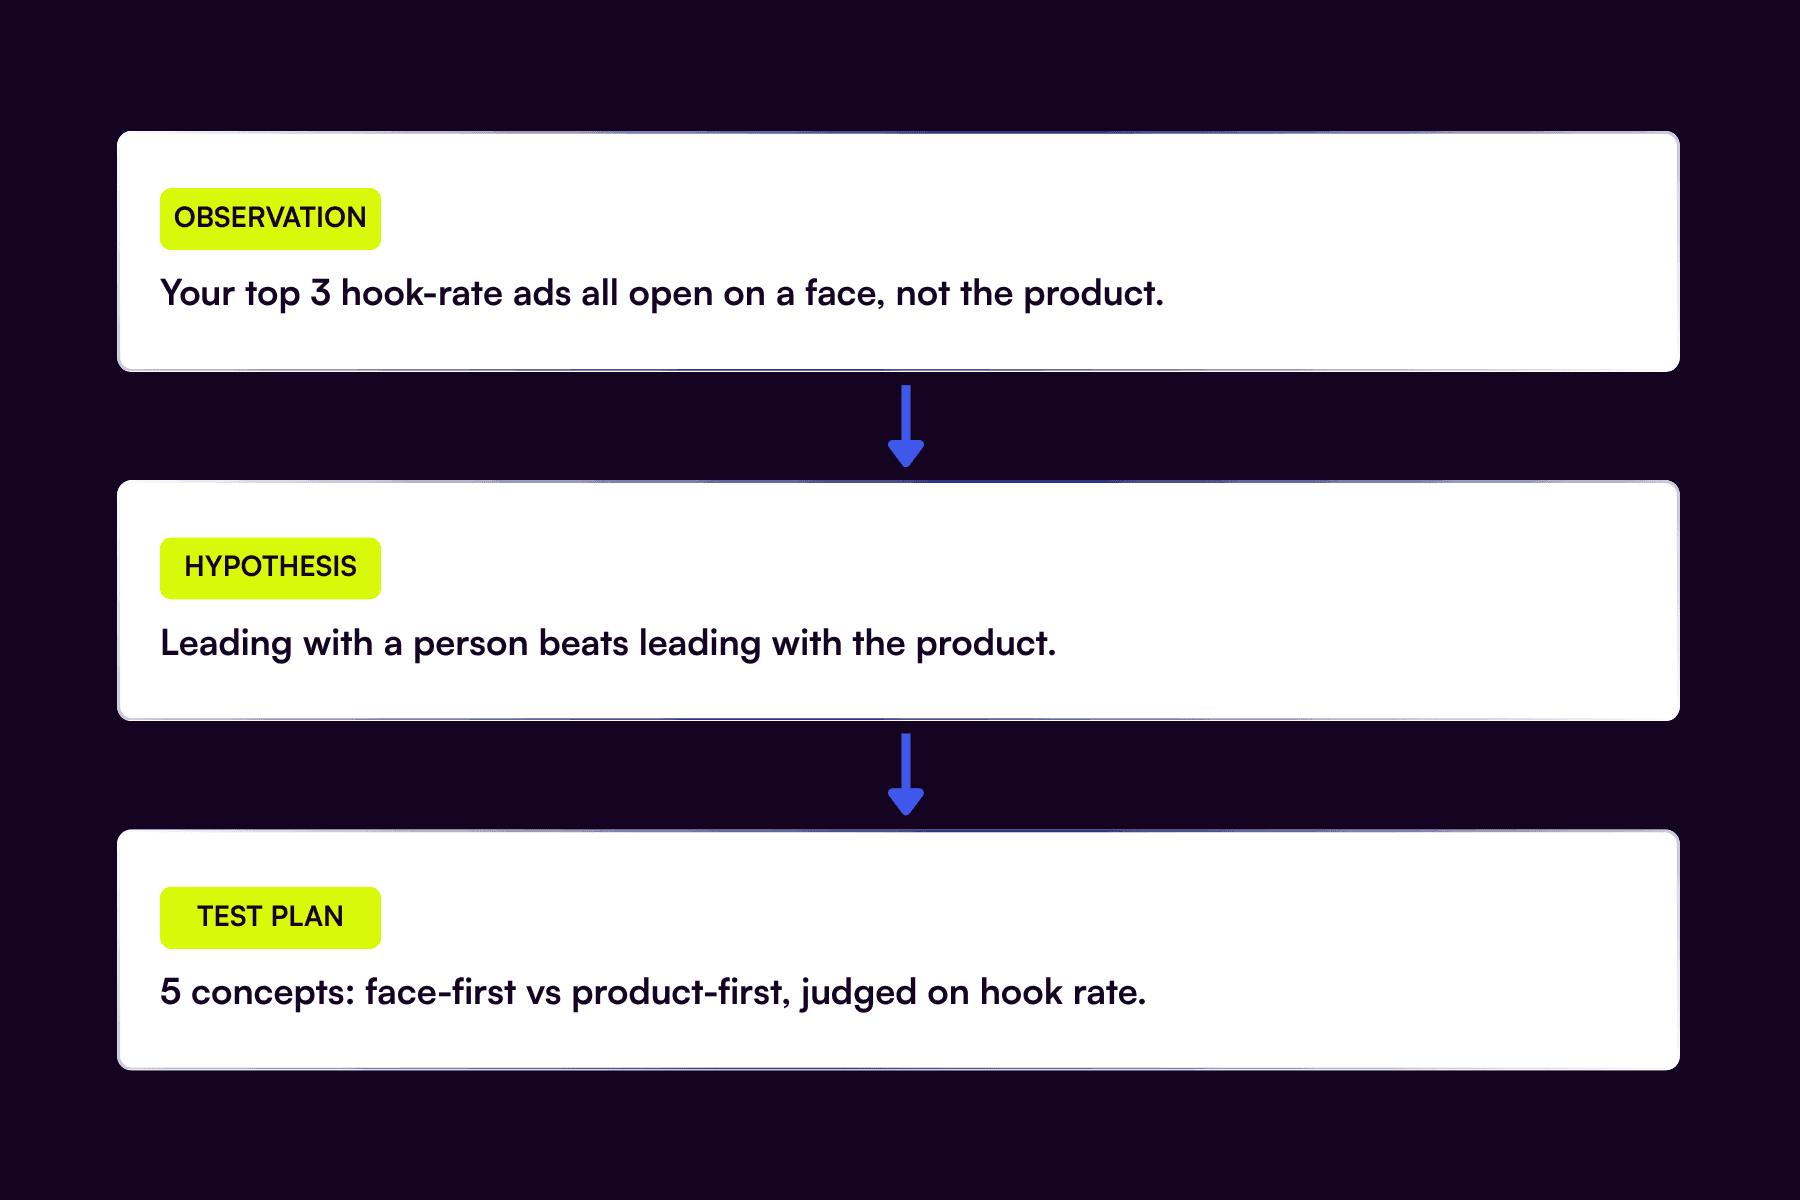
That's the difference between a hunch and a plan. You finish with a shortlist of quick wins and testable ideas for your next sprint.
This is exactly what the ad creative research system is built to systematize, and it's the same analytical habit that separates a strategist from someone who just makes ads. If you're working toward the role itself, see our guide on how to become a creative strategist.
Frequently asked questions
How do you analyze ad creatives? Start by finding your unicorn, the creative that has absorbed the most spend over the longest period. Break it into its building blocks: the hook, the pain point, the persona, the format, the proof, and the CTA. Then check which of those factors repeat across your other winners. That repeated combination is your creative success formula, and it tells you what to make next.
What is a unicorn ad? A unicorn ad is the single creative in your account that absorbs a disproportionate share of spend while maintaining strong performance over a long period. Almost every successful ad account has one, and it serves as the benchmark and blueprint for future creative.
How do I find my best-performing Facebook ads? Sort your account by total spend over a long window, not by last week's ROAS. The creative that has earned the most budget over the longest stretch, while still performing, is your unicorn. Short-term ROAS spikes are misleading because they reward recency, not staying power.
Why sort by spend instead of ROAS? Because the algorithm votes with budget. When a creative keeps earning spend across new campaigns and audiences over months, that durability is a stronger signal of a real winner than a single strong week of ROAS, which can be noise.
What is a creative fatigue rate? It's the share of your longer-term winners that are still performing in the last seven days. If most of your 30-day winners have dropped out of your 7-day top performers, your creative is fatiguing quickly, and you need to feed the account fresh concepts faster.
How far back should I look when analyzing creatives? Use two windows. Sort by spend over a long window to find your unicorn, then review the last six months in two-month blocks to separate evergreen principles from temporary trends and to confirm your unicorn is still holding.
How often should I run this analysis? A quick creative performance analysis works well before each production cycle or sprint, so your next batch of creative is informed by what your own data already proved, rather than guesswork.
The bottom line
You don't need to guess what to make next. Your best ad already told you. Find your unicorn, break down the exact combination of elements that makes it work, confirm the pattern across your other winners, and turn it into a formula you can reuse and test against.
The Quick Performance Analysis Worksheet that runs this whole process is one of 50+ resources inside Ad Creative Academy, built to turn your own account data into your next winning ad. Explore the curriculum and become a Certified Creative Strategist.